💰 Current Price
Loading...
Market Cap:
Loading...
24h Volume:
Loading...
📊 Performance
24h
Loading...
7d
Loading...
1M
Loading...
1Y
Loading...
📈 Mayer Multiple Analysis
Mayer Multiple
Loading...
200-day MA
Loading...
Bitcoin Price / 200 Day Moving Average (Mayer Multiple) - 1 Year
Historical Mayer Multiple showing Bitcoin price relative to its 200-day moving average.
Red line shows 2.4X backtesting threshold for buying opportunities.
Historical Distribution
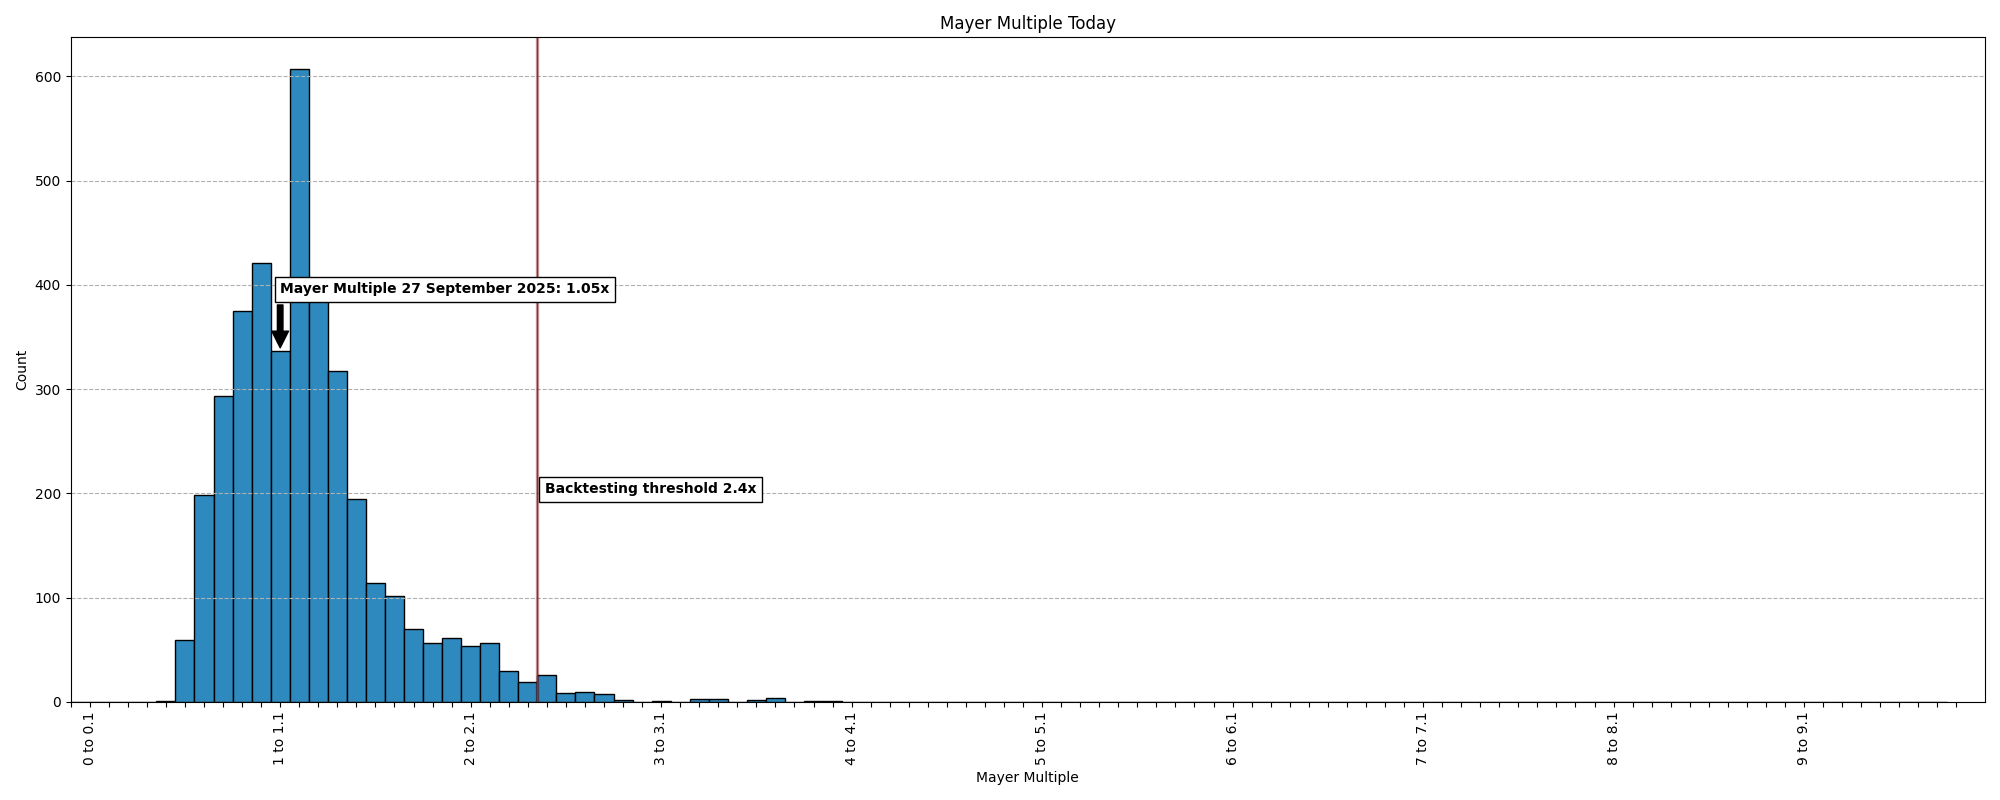
Historical Mayer Multiple distribution showing current position relative to past values.
Chart shows backtesting threshold of 2.4x and current reading.
🟡
Loading...
Loading...